Tutorial: Tracing code
Indeed, the ratio of time spent reading versus writing is well over 10 to 1. We are constantly reading old code as part of the effort to write new code. …[Therefore,] making it easy to read makes it easier to write.
— Robert C. Martin Clean Code: A Handbook of Agile Software Craftsmanship
To understand an unfamiliar codebase, one strategy is to trace some representative execution path through the codebase using a debugger.
Before we start
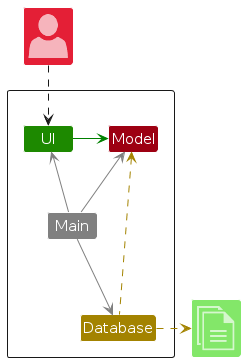
Before we jump into the code, it is useful to get an idea of the overall structure and the high-level behavior of the application.
Architecture diagrams can be easily utilised with the puml tag. The src attribute specifies the path to the PlantUML file.

Before we proceed, ensure that you have done the following:
- Read the Architecture section of the DG
- Set up the project in your preferred IDE
Setting a breakpoint
As you know, the first step of debugging is to put in a breakpoint where you want the debugger to pause the execution.
Tip: You can use a combination of Markbind's Images and Diagrams features such as puml and pic tags to provide a visual representation of the steps to be taken. Code blocks can also be used as shown below.
public interface Example {
    /**
     * Executes returns the output.
     * @param exampleInput The input as entered by the user.
     * @return The example output.
     * @throws ExampleException If an error occurs.
     */
    ExampleOutput execute(String exampleInput) throws ExampleException;
...
}
Tracing the execution path
Tip: You can use a list of steps to guide the reader through the process of tracing the execution path. This can be done using Markbind's Lists feature.
Firstly, do this.
Next, do that.
Finally, do this.